
No products in the cart.
-30%
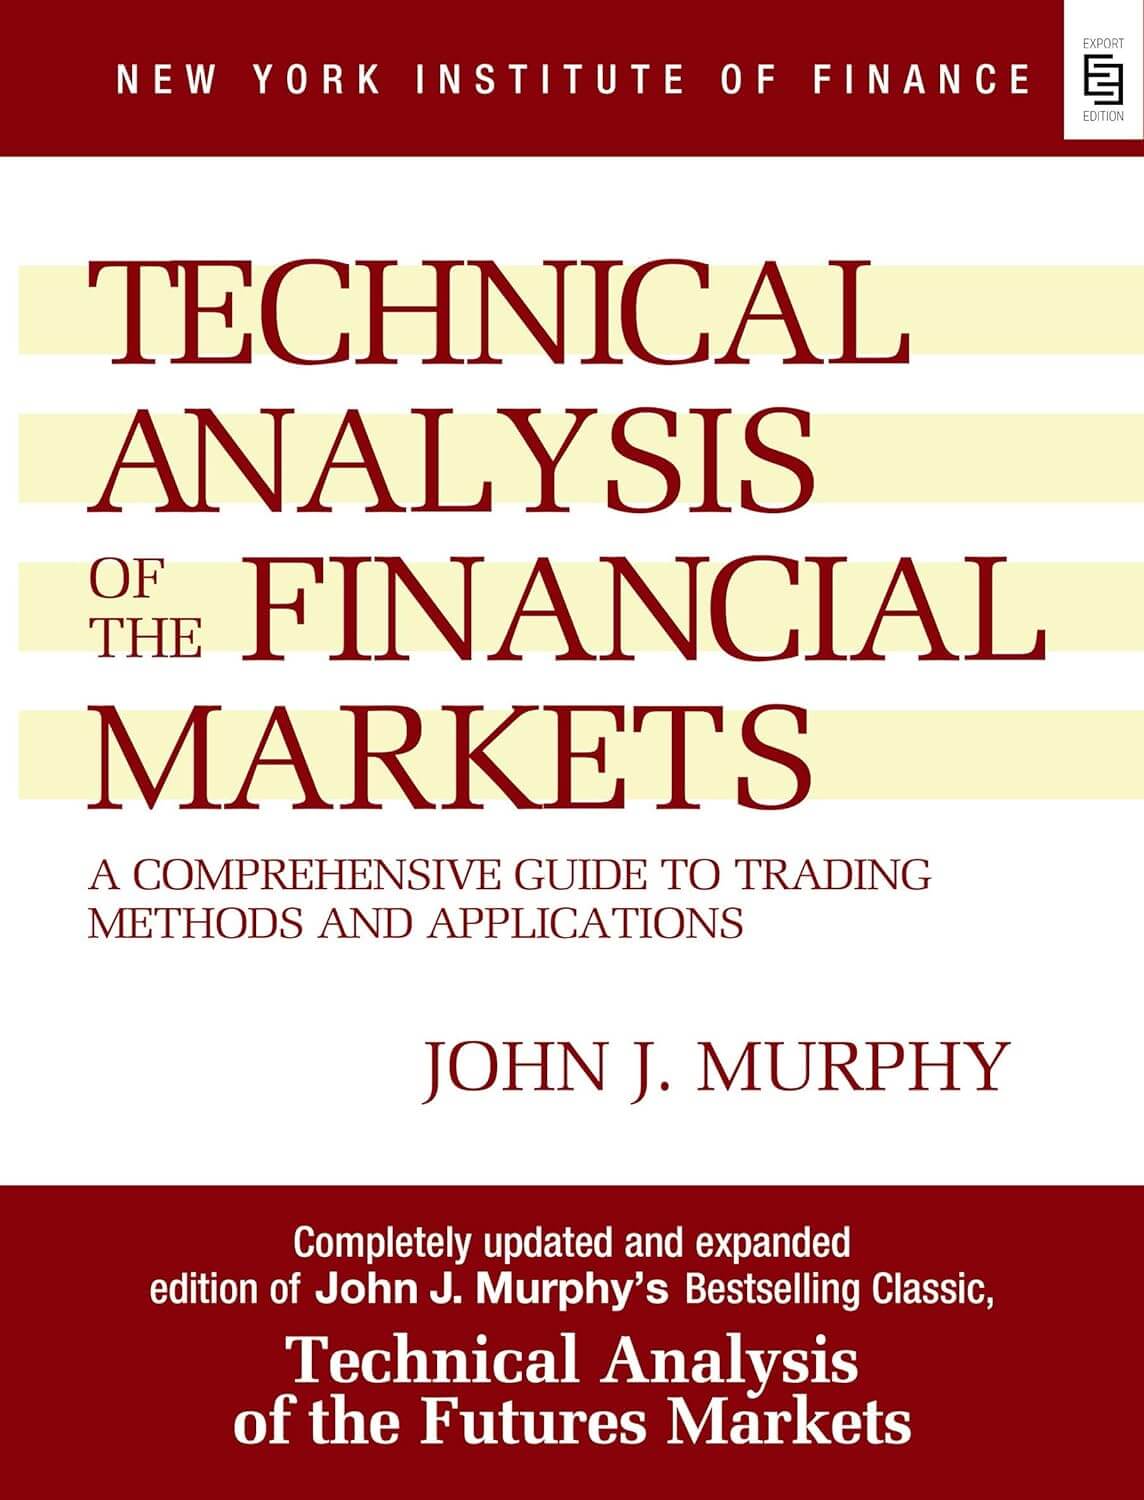
Technical Analysis of The Financial Markets by John J. Murphy [Hardcover]


Original price was: රු7,000.00.රු4,900.00Current price is: රු4,900.00.
3 X Rs. 1,633.33 or 8% Cashback with


or 3 X රු1,633.33 with


or up to 4 X රු1,225.00 with


Dive into the world of technical analysis with the timeless classic, ‘Technical Analysis of the Financial Markets’ by John J. Murphy. This comprehensive guide, presented in a sturdy hardcover format, equips readers with the essential tools to analyze and interpret financial markets. Murphy’s expertise and clarity make this book an indispensable resource for traders, investors, and anyone seeking a deep understanding of technical analysis.
Out of stock
Email when stock available
Technical Analysis of the Financial Markets by John J. Murphy
Technical Analysis of the Financial Markets by John J. Murphy is one of the most comprehensive reference books for readers who want to understand charts, trends, indicators, market behavior, technical analysis, and trading strategies.
This hardcover edition brings together many of the major concepts used by technical traders.
It covers chart construction, trends, support and resistance, price patterns, volume, moving averages, oscillators, candlestick analysis, cycles, Elliott Wave Theory, intermarket relationships, and other important analytical tools.
For traders, investors, finance students, and anyone studying market behavior, this book provides a detailed foundation.
About Technical Analysis of the Financial Markets
Technical Analysis of the Financial Markets is an expanded version of John J. Murphy’s earlier work on futures-market analysis.
The updated edition broadens the discussion beyond futures to include a wider range of financial markets.
Murphy explains how technical analysts study price, volume, momentum, trends, and market relationships.
The goal is not to predict the future with certainty.
Technical analysis instead attempts to identify patterns and probabilities from market behavior.
What Is Technical Analysis?
Technical analysis studies market activity, especially price and volume.
A technical analyst may use charts to identify trends.
They may examine support and resistance.
They may also use indicators to measure momentum or market strength.
Unlike fundamental analysis, technical analysis focuses heavily on what the market itself is doing.
Charts become an important source of information.
7 Powerful Lessons from Technical Analysis of the Financial Markets
1. Trend Is One of the Most Important Concepts
Markets often move in trends.
A trend may be upward.
It may be downward.
It may also move sideways.
Recognizing the current trend can help traders decide how to approach the market.
Murphy explains trendlines, channels, and related concepts in detail.
2. Support and Resistance Matter
Support is an area where buying pressure may become stronger.
Resistance is an area where selling pressure may become stronger.
These levels can influence future price behavior.
They may also change roles.
Old resistance can become support after a breakout.
Old support can become resistance after a breakdown.
Understanding this behavior is an important part of chart analysis.
3. Price Patterns Can Reveal Market Structure
Technical Analysis of the Financial Markets explains many classic chart patterns.
These include reversal and continuation formations.
Head-and-shoulders patterns are discussed.
Triangles are important.
Double tops and double bottoms can also provide information.
Patterns do not guarantee outcomes.
They help traders organize what price is doing.
4. Volume Can Confirm Price Movement
Price alone does not always tell the full story.
Volume can add context.
A breakout supported by strong volume may appear more significant than one occurring with weak participation.
Murphy explains why volume is often used to confirm trends and chart patterns.
5. Indicators Should Support Analysis
Technical indicators can provide useful information.
However, relying on too many indicators can create confusion.
Moving averages can help identify trends.
Oscillators can help measure momentum.
Other tools may show overbought or oversold conditions.
The book explains how indicators can be combined with broader chart analysis.
6. Candlestick Charts Add Another Perspective
The revised edition includes material on candlestick charting.
Candlestick charts display opening, closing, high, and low prices visually.
Different formations may suggest changes in market sentiment.
Individual candles are useful.
But context matters.
Candlestick patterns are generally stronger when considered together with trend, support, resistance, and volume.
7. Markets Are Connected
One of the more advanced lessons is that financial markets do not always move independently.
Interest rates can influence stocks.
Currencies can affect commodities.
Commodity prices may influence particular sectors.
Murphy discusses intermarket relationships as part of understanding the broader financial environment.
Understanding Trend Analysis
Trend analysis is central to Technical Analysis of the Financial Markets.
An uptrend generally contains higher highs and higher lows.
A downtrend tends to show lower highs and lower lows.
Sideways markets behave differently.
Recognizing which environment exists can influence which trading strategy makes sense.
Trendlines can help visualize direction.
Channel lines can add more structure.
Support and Resistance
Support and resistance are among the most widely used technical concepts.
When price repeatedly stops falling near the same area, traders may identify support.
When price repeatedly struggles to move higher, that area may become resistance.
These levels are not always exact numbers.
They may function more like zones.
Breakouts can also change how traders view them.
Chart Patterns
Murphy explains major chart patterns that traders have studied for decades.
Some patterns may suggest continuation.
Others may suggest reversal.
The important point is structure.
Technical traders look at how buyers and sellers behave during consolidation, breakout, and reversal phases.
A chart pattern is not magic.
It is a way of interpreting market behavior.
Moving Averages
Moving averages smooth price data.
This makes it easier to observe broader direction.
Shorter moving averages respond more quickly.
Longer moving averages change more slowly.
Traders may compare different averages.
They may also study whether price is above or below a moving average.
Murphy explains how these tools can help with trend analysis.
Oscillators and Momentum
Markets do not move at the same speed all the time.
Momentum indicators attempt to measure the strength of a move.
Oscillators can sometimes help identify extreme conditions.
However, an overbought market does not automatically mean price must fall.
Likewise, an oversold market does not automatically mean price must rise.
Context remains important.
Candlestick Analysis
Candlestick charts are popular because they communicate several pieces of price information visually.
Each candle can show the open, close, high, and low.
Long candles may indicate strong movement.
Small candles may reflect hesitation.
Different patterns can suggest changing momentum.
Murphy includes candlestick material as part of the expanded edition.
Elliott Wave Theory
Technical Analysis of the Financial Markets also introduces Elliott Wave Theory.
This approach attempts to identify recurring wave structures in market psychology.
The method can be complex.
It is generally used alongside other forms of analysis rather than in isolation.
Readers interested in advanced chart interpretation may find this section particularly useful.
Fibonacci Concepts
Fibonacci ratios are frequently used in technical analysis.
Traders may use them to study retracement and projection levels.
These levels are not guaranteed turning points.
They are reference areas.
Combining them with other evidence can provide more useful context.
Market Cycles
Financial markets can display cyclical behavior.
Murphy discusses the idea that markets sometimes move through recurring phases.
Cycles may relate to time.
They may also interact with trend and momentum.
Understanding cycles can help traders think beyond individual candles or short-term moves.
Intermarket Analysis
Different markets can influence each other.
This makes intermarket analysis especially valuable.
Stock markets may respond to changes in interest rates.
Currency movement can affect commodities.
Energy prices may influence particular industries.
Looking beyond a single chart can provide a broader understanding of market conditions.
Stock Market and Sector Analysis
The expanded edition also discusses stocks and stock rotation.
Different market sectors may perform differently at different stages of an economic or market cycle.
Technical analysis can therefore be applied not only to individual securities but also to broader groups.
This can help traders identify relative strength.
Risk Management Is Still Essential
No chart pattern works every time.
No technical indicator produces perfect signals.
A strong trend can reverse.
A breakout can fail.
Unexpected news can rapidly change market conditions.
That is why risk management remains essential.
Technical analysis should help organize decisions.
It should never be treated as a guarantee of profit.
Avoid Indicator Overload
One common mistake is using too many indicators.
A chart can quickly become overcrowded.
Several indicators may also measure similar information.
More tools do not automatically produce better decisions.
A clearer approach may be to combine a few complementary tools.
Trend, support and resistance, volume, and momentum can already provide substantial information.
Use Confirmation
Confirmation can strengthen a setup.
For example, a breakout may look more convincing when volume increases.
A reversal near support may look stronger when momentum also begins improving.
Multiple independent pieces of evidence can make analysis more structured.
However, confirmation still cannot eliminate risk.
Who Should Read This Book?
Technical Analysis of the Financial Markets is ideal for traders, investors, finance students, analysts, and readers interested in financial markets.
Beginners can use it as a detailed introduction.
Intermediate traders may use it as a reference.
More experienced readers can revisit specific chapters on indicators, cycles, candlesticks, Elliott Wave Theory, and intermarket analysis.
Because the book covers so many topics, it works particularly well as a long-term reference rather than something that must be read only once.
About John J. Murphy
John J. Murphy is a widely known technical analyst and financial-market author.
He previously worked as a technical analyst for CNBC.
He also served as director of Merrill Lynch’s Technical Analysis Futures Division.
His other books include The Visual Investor and Intermarket Technical Analysis.
Readers can learn more through the official Penguin Random House page for Technical Analysis of the Financial Markets.
Product Details
Title: Technical Analysis of the Financial Markets
Subtitle: A Comprehensive Guide to Trading Methods and Applications
Author: John J. Murphy
Format: Hardcover
Genre: Finance / Investing / Trading / Technical Analysis
Language: English
Publisher: Prentice Hall Press
Publication Date: January 1, 1999
ISBN-13: 9780735200661
Pages: 576
Dimensions: Approximately 7 × 9.25 inches
This is the commonly listed Prentice Hall Press hardcover edition.
Other international editions may carry different ISBNs.
Always confirm the ISBN printed on your physical copy before entering final WooCommerce specifications.
Explore More Trading and Finance Books
Technical Analysis of the Financial Markets provides readers with a broad foundation in chart-based market analysis.
It explains trend.
It explains support and resistance.
It covers volume, momentum, chart patterns, candlesticks, cycles, and technical indicators.
It also goes further into intermarket relationships and other advanced topics.
Readers interested in financial markets, trading, investing, and technical analysis can explore more Business, Finance & Economics Books at Bargain Books.
For readers looking for a detailed reference on technical analysis, Technical Analysis of the Financial Markets remains one of the most comprehensive books available in the field.
| Author | Moritz Czubatinski & Rolf Schlotmann |
|---|---|
| Type | Paperback Printed Book |
| ISBN/ISSN | 059333244X, 978-0593332443 |
| Language | English |
| Pages | 576 |
Be the first to review “Technical Analysis of The Financial Markets by John J. Murphy [Hardcover]”
Related products

Out of stock
Business, Finance & Economics
රු1,700.00
3 X Rs. 566.67 or 8% Cashback with
or 3 X රු566.67 with
or up to 4 X රු425.00 with
-22%

Out of stock
Business, Finance & Economics
Original price was: රු2,250.00.රු1,750.00Current price is: රු1,750.00.
3 X Rs. 583.33 or 8% Cashback with
or 3 X රු583.33 with
or up to 4 X රු437.50 with
-31%

Business, Finance & Economics
Original price was: රු1,600.00.රු1,100.00Current price is: රු1,100.00.
3 X Rs. 366.67 or 8% Cashback with
or 3 X රු366.67 with
or up to 4 X රු275.00 with

රු2,000.00
3 X Rs. 666.67 or 8% Cashback with
or 3 X රු666.67 with
or up to 4 X රු500.00 with

Out of stock
Business, Finance & Economics
රු1,900.00
3 X Rs. 633.33 or 8% Cashback with
or 3 X රු633.33 with
or up to 4 X රු475.00 with
-16%

Business, Finance & Economics
Original price was: රු3,150.00.රු2,650.00Current price is: රු2,650.00.
3 X Rs. 883.33 or 8% Cashback with
or 3 X රු883.33 with
or up to 4 X රු662.50 with
-16%

Out of stock
Business, Finance & Economics
Original price was: රු1,900.00.රු1,600.00Current price is: රු1,600.00.
3 X Rs. 533.33 or 8% Cashback with
or 3 X රු533.33 with
or up to 4 X රු400.00 with
-17%

Out of stock
Original price was: රු2,900.00.රු2,400.00Current price is: රු2,400.00.
3 X Rs. 800.00 or 8% Cashback with
or 3 X රු800.00 with
or up to 4 X රු600.00 with
Reviews
There are no reviews yet.